
Kick
May 08, 2022
A problem results from the Drilling Pipe sticking inside the Hole and the inability to rotate or move inside and outside the Hole.
Sand production can be a severe problem for both reservoir and facilities. Understanding the type of sandstone reservoir and grain size can give a primary indication about the case but having a geomechanics model and plotting the sand production critical bottom hole flowing pressure can optimize the case. Sand production can be exhibited in unconsolidated reservoirs or consolidated depleted reservoirs. The severity and possibility of sand production increase in shallower depths and depleted reservoir pressures.
The ability to predict when a reservoir will fail and produce sand is fundamental to decide whether to use downhole sand control and what type of sand control to use. The production of sand depends on three main components:
There is more than an approach to drive the sand production envelope. One of them is using core analysis and logs to reach uniaxial compression stress (UCS), poison ratio, boit’s constant, min and max horizontal stresses.


From Fig.1, The frame of stresses shows the parameters controlling 1 and 2, for the worst case (highest stress), it is easier to replace 1 as the greater of x and y and 2 as the lesser of x and y.
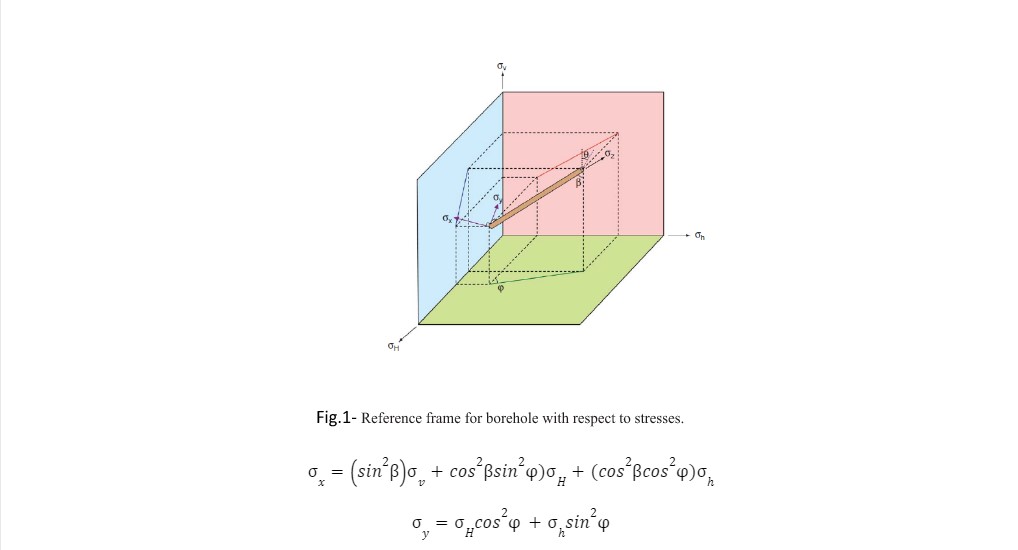
θ the position around the circumference of the borehole, the well inclination and the hole azimuth relative to the principal horizontal stress.
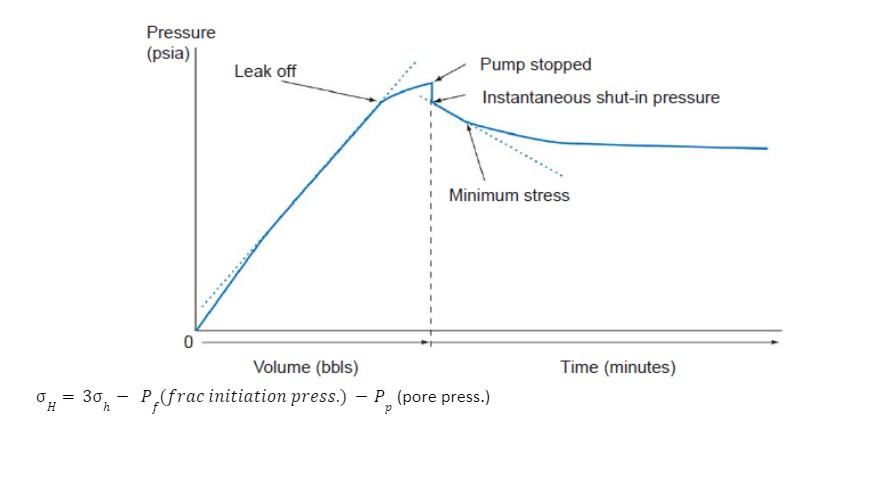
Fig.2 shows the use of extended leak off test to get insight about min stress.
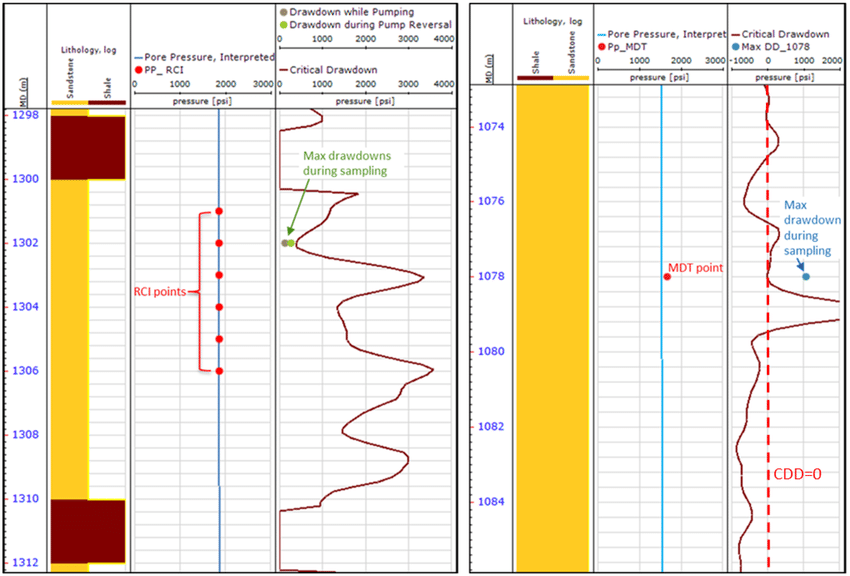
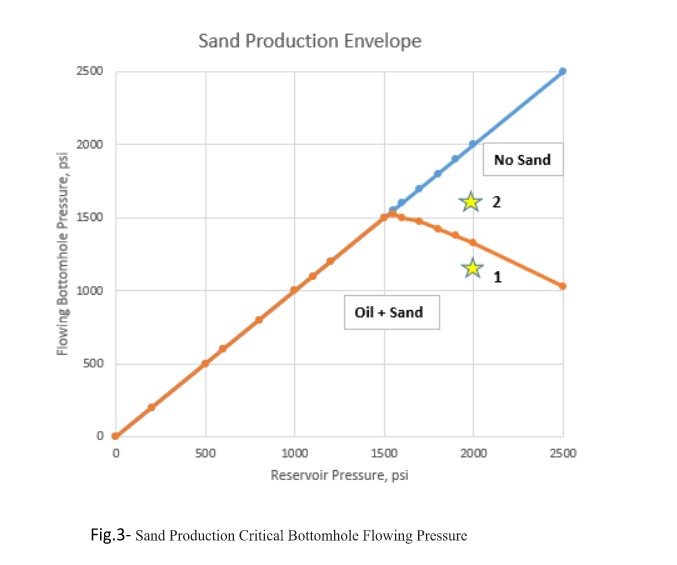
In Fig.3, critical bottomhole flowing pressure for sand production in a well was producing with DD of 850 psi in condition 1 resulted sand fill, but with optimized DD of 450 psi, no sand production.
 \
\
Sand production is not only a problem for facilities but it can also affect the near wellbore damage and the run life of the artificial lift used. So, applying the critical drawdown and having a well-by-well model for sand production prediction and mitigation can save time and costs. Sand production mitigation can be also through enlarging the no sanding window by assisting the reservoir pressure through injection for highly depleted reservoirs. Sand control mechanisms can be considered in the early phase of reservoir development if the no sand region is so small or does not exist.

Lorem ipsum dolor sit, consectetur iscing sed diam nonummy nibh euismo Lorem ipsum dolor sit, consectetur

